Probes
Probes are validation mechanisms that monitor and verify the health of your system throughout chaos experiments. They act as automated checkpoints that determine whether your system maintains expected behavior under failure conditions.
How Probes Affect Resilience Score
Each probe in an experiment contributes to the overall resilience score. When a probe executes, it results in either a PASS or FAIL state:
- PASS - The system met the expected criteria (e.g., HTTP 200 response, metric within threshold)
- FAIL - The system did not meet the expected criteria
The resilience score is calculated as a weighted average of all probe and fault outcomes in the experiment. A higher pass rate across probes means a higher resilience score, giving you a quantifiable measure of your system's ability to withstand failures.
Probe Types
Harness supports the following probe types. To create a probe, navigate to Project Settings > Chaos Probes and click + New Probe. Select your infrastructure type, then choose from:
- HTTP Probe - Validate service endpoints by checking HTTP response codes or body content
- Command Probe - Run shell commands and match output for custom validation logic
- Kubernetes Probe - Verify Kubernetes resource state (present, absent, delete)
- Container Probe - Execute commands inside a container with full control over image, volumes, and security context
- APM Probes - Query metrics from monitoring systems like Prometheus, Datadog, Dynatrace, New Relic, Splunk, AppDynamics, and GCP Cloud Monitoring via Harness Platform connectors
All probes follow the same creation wizard: Overview → Variables → Probe Properties → Run Properties. The probe-specific configuration happens in the Probe Properties step; everything else is common across all probe types. See the individual probe pages for step-by-step details.
Infrastructure Support
Not all probes are available on every infrastructure type. The following table shows which probes are supported on each infrastructure:
| Probe | Kubernetes | Linux | Windows |
|---|---|---|---|
| HTTP Probe | ✅ | ✅ | ✅ |
| Command Probe | ✅ | ✅ | ✅ |
| Kubernetes Probe | ✅ | - | - |
| Container Probe | ✅ | - | - |
| APM Probes | ✅ | - | - |
| Datadog Probe | ✅ | ✅ | - |
| Dynatrace Probe | ✅ | ✅ | - |
The table shows native (inline) support on each infrastructure. Probes that are native to Kubernetes only, such as the Kubernetes Probe, Container Probe, and APM probes, can also run in Linux and Windows experiments through remote Kubernetes execution. Go to Remote Kubernetes Execution to understand how this works.
Remote Kubernetes Execution
When you run an experiment on a Linux or Windows infrastructure, you can also run Kubernetes probes by mapping a Kubernetes infrastructure to the experiment. Linux and Windows probes run inline on the target machine, while the mapped Kubernetes probes run remotely on the mapped Kubernetes infrastructure.
This lets you use Kubernetes-only probes, such as the Kubernetes Probe, Container Probe, and APM probes, alongside your Linux and Windows experiments without recreating them for each infrastructure.
You map a Kubernetes infrastructure in one of two ways:
- When you set up the Linux or Windows infrastructure, where the mapped Kubernetes infrastructure applies to experiments on that infrastructure.
- When you add a probe to an experiment, where you map a Kubernetes infrastructure to that probe so it runs as a remote probe.
Remote Kubernetes execution gives you the following benefits:
- Reuse across infrastructures: Use the same probe definition and logic on Kubernetes, Linux, and Windows infrastructures.
- Access to Kubernetes-only capabilities: Use features such as external secrets in Linux and Windows experiments.
- Less duplicate maintenance: Keep a single probe definition instead of maintaining separate probes per infrastructure.
Built-in Probe Templates
Harness provides pre-built Built-in Probe Templates to help you quickly set up probes for common validation scenarios. Currently, built-in templates are available for Command Probes targeting Kubernetes infrastructure, covering checks like pod status, node health, resource utilization, and cloud provider resource validation.
Probe Verification
Probes can be marked as Verified to ensure only tested and approved probes are used in production experiments. This governance feature helps teams maintain quality standards and prevent misconfigurations.
To mark a probe as verified:
-
Navigate to Project Settings > Chaos Probes
-
Click the three-dot menu (⋮) next to the probe
-
Select Mark as Verified
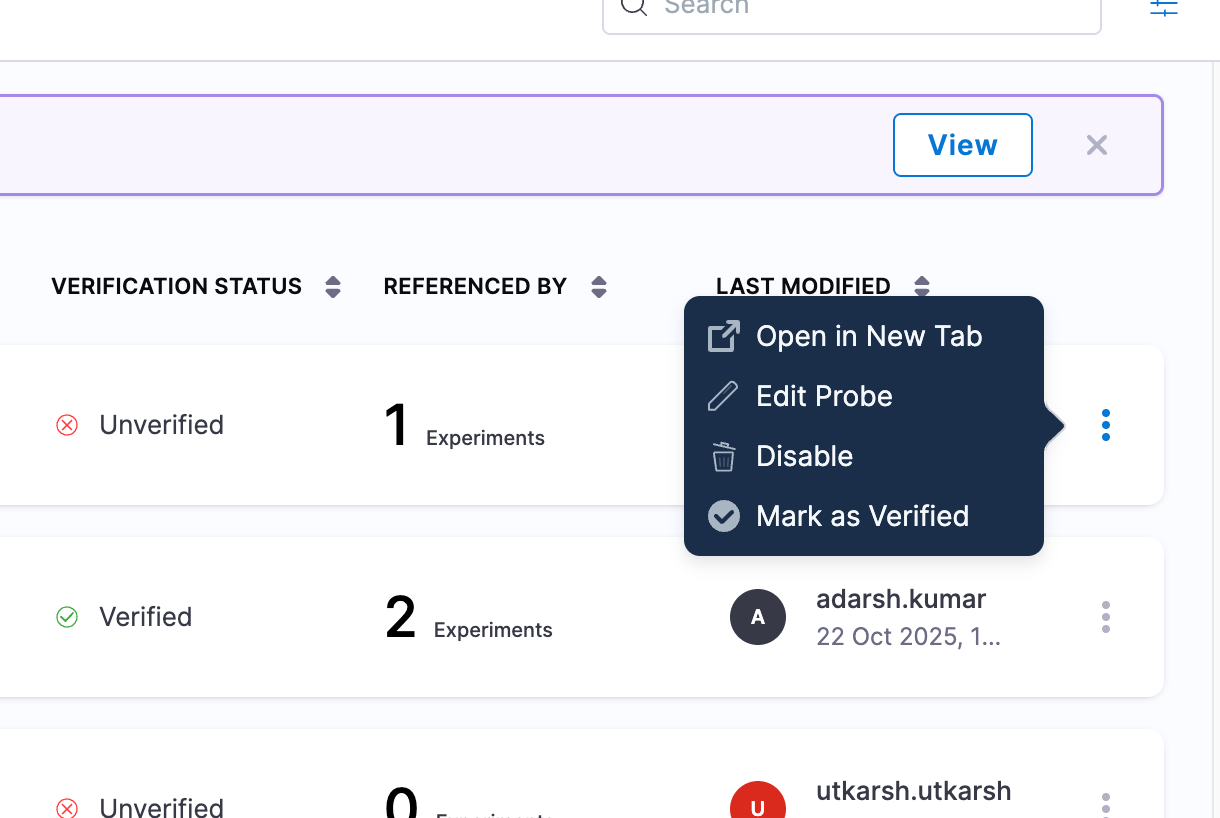
Once verified, the probe displays a green checkmark (✓) in the Verification Status column. You can then use ChaosGuard policies to mandate that only verified probes can run in experiments.
Next Steps
- Create Chaos Experiments - Build experiments with probes
- ChaosHub - Discover and share experiment templates
- ChaosGuard - Enforce governance policies on probe usage